Project
- Ventilator Pressure Prediction
- Project date: 09 June, 2020
- Project URL: Ventilator-Pressure-Prediction.git
- Developed a model using Linear Regression and LightGBM to predict the required ventilator pressure based on patient lung’s data from ventilator data set from Kaggle.
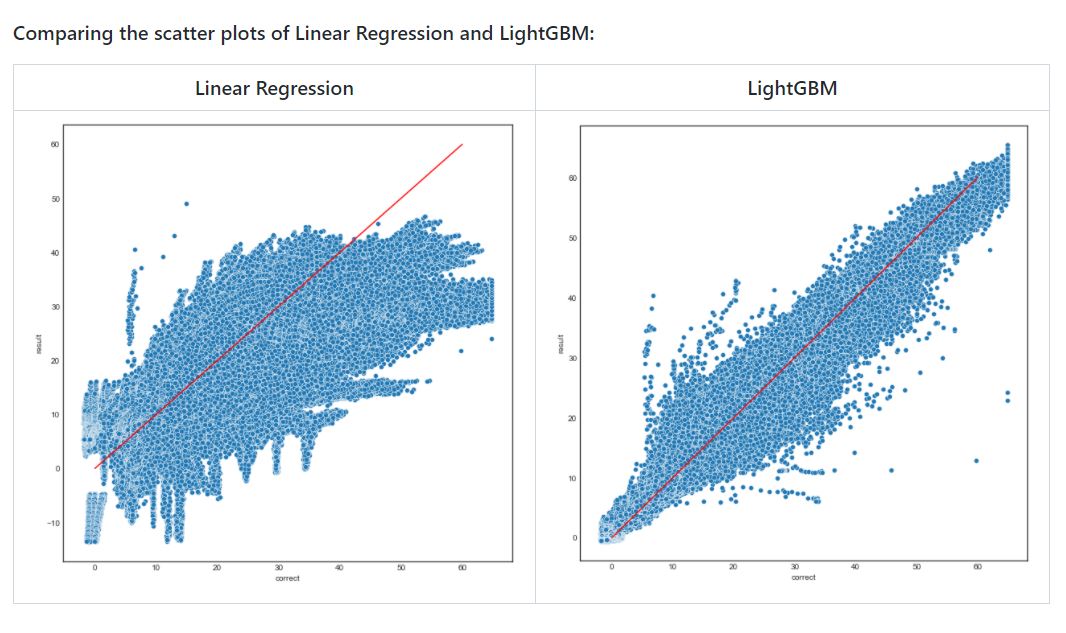
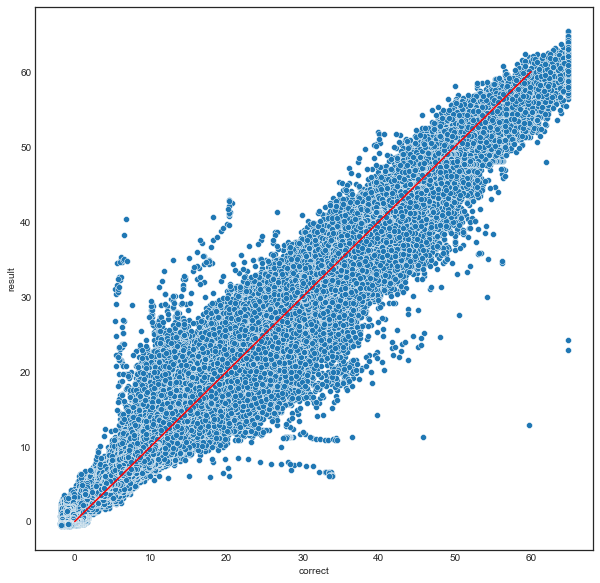
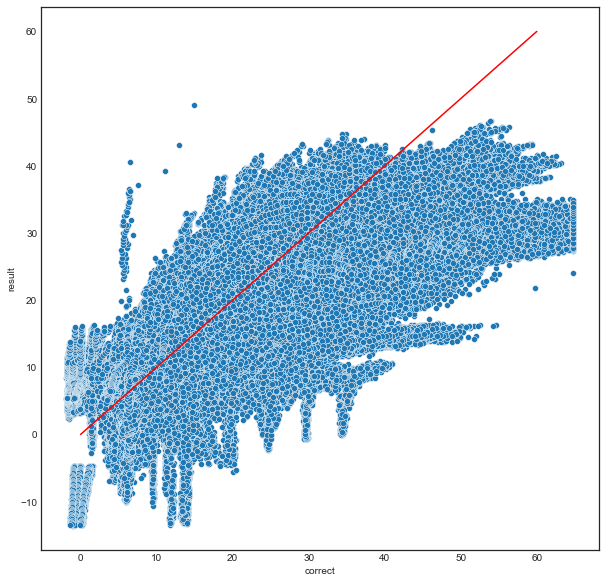
- Performed Data Visualization using Matplotlib and Compared the prediction results of LighGBM regression and Linear Regression through Scikit-Learn.
About project
What do doctors do when a patient has trouble breathing? They use a ventilator to pump oxygen into a sedated patient's lungs via a tube in the windpipe. But mechanical ventilation is a clinician-intensive procedure, a limitation that was prominently on display during the early days of the COVID-19 pandemic. At the same time, developing new methods for controlling mechanical ventilators is prohibitively expensive, even before reaching clinical trials. High-quality simulators could reduce this barrier.
Current simulators are trained as an ensemble, where each model simulates a single lung setting. However, lungs and their attributes form a continuous space, so a parametric approach must be explored that would consider the differences in patient lungs. We believe that the neural networks and deep learning can better generalize across lungs with varying characteristics than the current industry standard of PID controllers.
About the Data
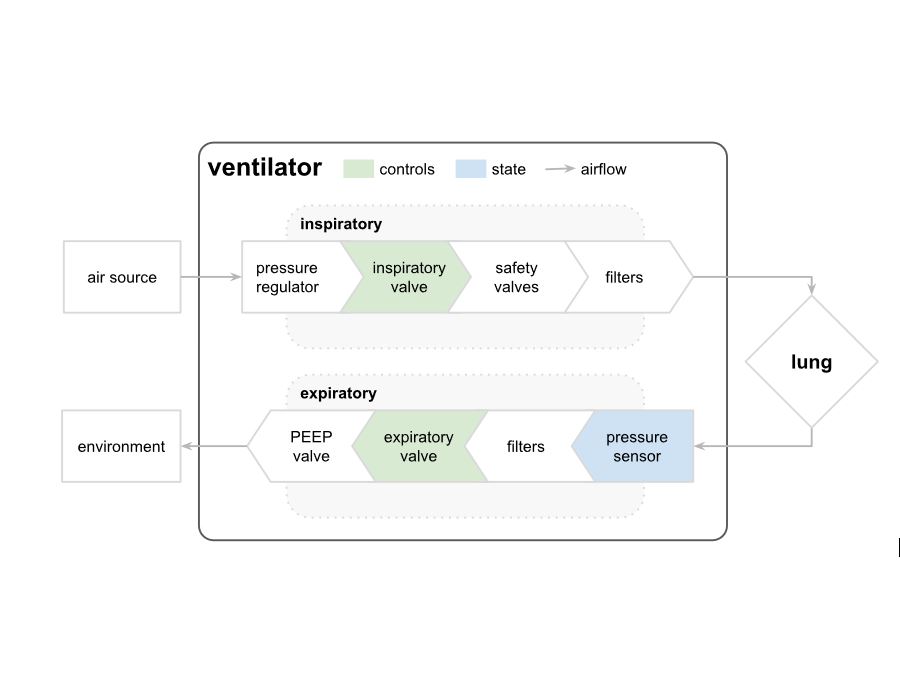
The ventilator data used in this competition was produced using a modified open-source ventilator connected to an artificial bellows test lung via a respiratory circuit. The diagram below illustrates the setup, with the two control inputs highlighted in green and the state variable (airway pressure) to predict in blue. The first control input is a continuous variable from 0 to 100 representing the percentage the inspiratory solenoid valve is open to let air into the lung (i.e., 0 is completely closed and no air is let in and 100 is completely open). The second control input is a binary variable representing whether the exploratory valve is open (1) or closed (0) to let air out.
In this competition, participants are given numerous time series of breaths and will learn to predict the airway pressure in the respiratory circuit during the breath, given the time series of control inputs.

Each time series represents an approximately 3-second breath. The files are organized such that each row is a time step in a breath and gives the two control signals, the resulting airway pressure, and relevant attributes of the lung, described below.
Files
- train.csv - the training set
- sample_submission.csv - a sample submission file in the correct format
Columns
- id - globally-unique time step identifier across an entire file
- breath_id - globally-unique time step for breaths
- R - lung attribute indicating how restricted the airway is (in cmH2O/L/S). Physically, this is the change in pressure per change in flow (air volume per time). Intuitively, one can imagine blowing up a balloon through a straw. We can change R by changing the diameter of the straw, with higher R being harder to blow.
- C - lung attribute indicating how compliant the lung is (in mL/cmH2O). Physically, this is the change in volume per change in pressure. Intuitively, one can imagine the same balloon example. We can change C by changing the thickness of the balloon’s latex, with higher C having thinner latex and easier to blow. time_step - the actual time stamp.
- u_in - the control input for the inspiratory solenoid valve. Ranges from 0 to 100.
- u_out - the control input for the exploratory solenoid valve. Either 0 or 1.
- pressure - the airway pressure measured in the respiratory circuit, measured in cmH2O.
This will pave the way for algorithms that adapt to patients and reduce the burden on clinicians during these novel times and beyond. As a result, ventilator treatments may become more widely available to help patients breathe.
Comparison
Comparing Scatter plots of Linear Regression and LightGBM
| LightGBM | Linear_Regression |
|---|---|
 |
 |