
SpaceX: Falcon 9 Landing Prediction IBM Data Science Project
- Data Scraping, Pridictive Modeling with Classification
- Client: IBM Data Science
- Project date: 12 Aug, 2021
- Project URL: Applied-Data-Science-Capstone-Project.git
SpaceX: Falcon 9 Landing Prediction IBM Data Science Project
Project background and context
- SpaceX is a company that aims to make commercial space travel more affordable for everyone.
- This company can launch rockets for a cost of around 60 million dollars. In contrast, other providers require165 million dollars for one launch. This is due to the fact that SpaceX can reuse the first stage of the rocket Falcon9.
- The primary cost saving agent is the high success rate of stage 1 landing and thus its reusability in future launches.
- The challenge here is to set a right costing fore cast of the rocket launches through predicting its potential to land stage 1 successfully.
Problems you want to find answers
- What are features that contributes the most to predict whether the stage one of the rocket will and land successfully?
- Can we predict if the new launches will be successful based on our trained model. What will be the accuracy of our predictions?
Data collection methodology:
Data was collected using the SpaceX REST API and Wikipedia Web scrapping using python BeautifulSoup. The data is collected:
- Using SpaceX API.
- Using BeautifulSoup library to scrap data from the Wikipedia page.
Data Collection – SpaceX API
- Request launch data from SpaceX URL using given API.
- Extract the data from the response.
- Pre-process and construct the data.
- Store the data in CSV file.
- Notebook Link
Data Collection - Scraping
- Request for the Wikipedia page.
- Parse the table data from html text using beautifulSoup4 library.
- Create pandas data frame from table data.
- Construct the data and store it in CSV.
- Notebook Link
Perform Data Wrangling
Data was processed using python pandas and numpy library.
- Calculate the number of launches per site.
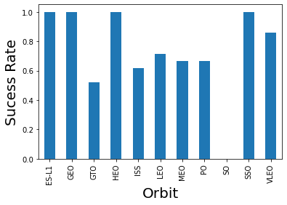
- Number of occurrence of each orbit.
- Number of occurrences of outcome per orbit.
- Create landing outcome label.
- Notebook Link
EDA with Data Visualization
 |
 |
Perform exploratory data analysis (EDA) using visualization and SQL
- Display the names of the unique launch sites in the space mission.
- Display 5 records where launch sites begin with the string ‘CCA’ .
- Display the total payload mass carried by boosters launched by NASA.
- Display average payload mass carried by booster version ‘F9 v1.1’.
- List the date when the first successful landing outcome in ground pad was achieved.
- List the names of the boosters which have success in drone ship and have payload mass greater than 4000 but less than 6000.
- List the total number of successful and failure mission outcomes.
- List the names of the booster versions which have carried the maximum payload mass.
- List the failed landing outcomes in drone ship, their booster versions, and launch site names for in year 2015.
- Rank the count of landing outcomes (such as Failure (drone ship) or Success (ground pad)) between the date 2010 06 04 and 2017 03 20 , in descending order.
- Notebook Link
Perform interactive visual analytics using Folium and Plotly Dash
Map objects which are created and added to the folium map are given below:
- Markers: Added to mark a specific area with a text label on a specific coordinate.
- Circles: Added to highlight circle areas with a text label on a specific coordinate.
- Marker Cluster: Marker clusters were used to simplify the containing many markers having the same coordinates.
- Mouse Position: Used to get coordinate for a mouse over a point on the map (proximities). It helps to find the coordinates easily of any points of interests while exploring the map.
- Polyline: It draws polyline overlays on a map. It was used to denote the distance between a launch site and its proximities(such as Railway station, city, etc.).
- Notebook Link
Build a Dashboard with Plotly Dash
Pie chart (total launches for a selected site or the total sites collection)
- Shows relative proportions of different sites successful landing distribution.
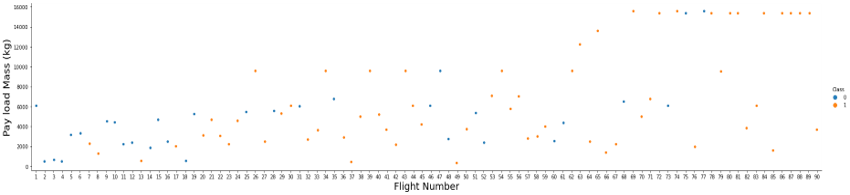
- Shows % of success vs. failure for a given site. Scatter Plot
- Showing the correlation between Outcome and Payload Mass(Kg) for different Booster Versions with freedom of selection of the range of payload mass of Interest.
- Code Link
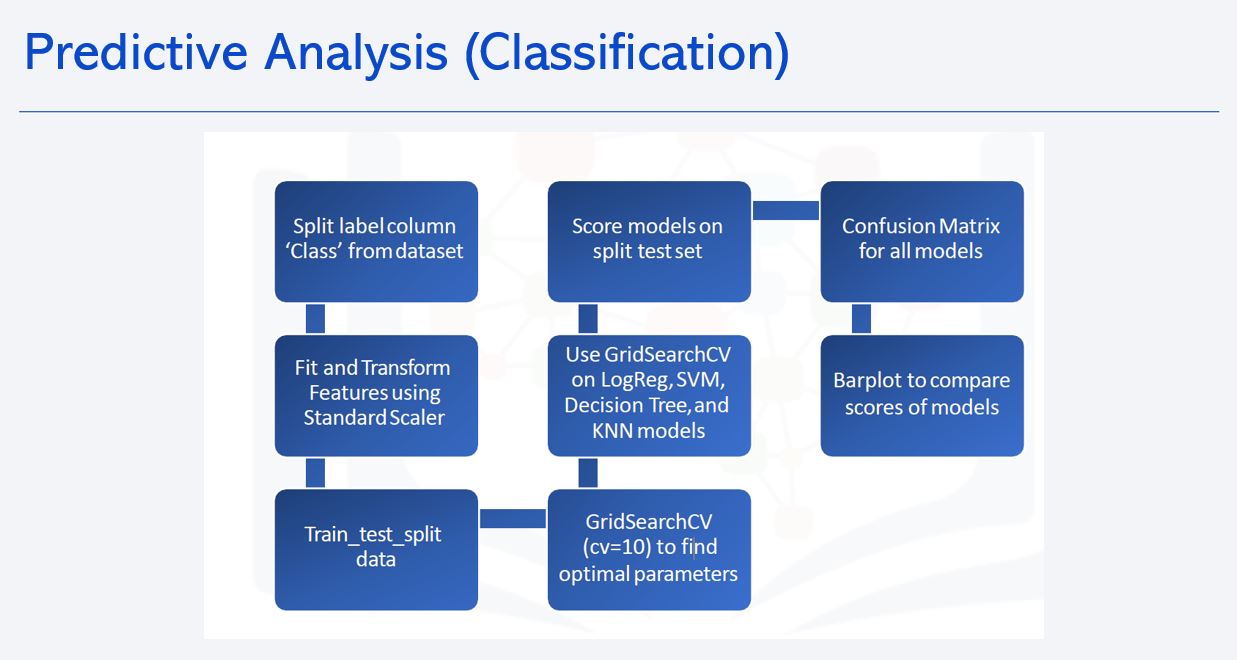
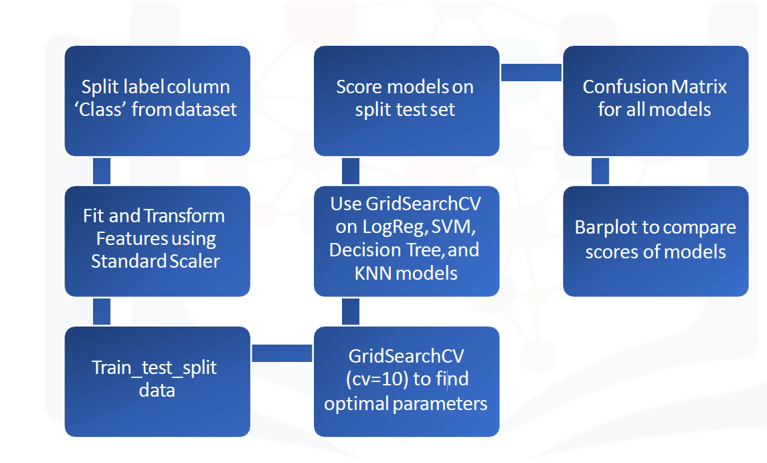
Perform predictive analysis using classification models
Models were built using Scikit-Learn, data were previously normalized and models hyper parameters were found using a Grid Search with a 10 fold cross validation, in the end the best performing model has been selected based on accuracy.
Classification models (Experiment usability and compatibility of SVM, Tree maps, KNN, Logistic Regression optimizing parameters) were built, evaluated and tuned using sklearn.
Predictive Analysis (Classification)
Launch sites are :
- CCAFS LC-40
- CCAFS SLC-40
- KSC LC-39A
- VAFB SLC-4E
SQL QUERY: select distinct(launch_site) from SPACEXTBL;
- The total payload carried by boosters from NASA is 45596 kg.
SQL QUERY: select sum(payloadmass__kg) from SPACEXTBL where customer = 'NASA (CRS)';
- The average payload mass carried by booster version F9 v1.1 is 2534 kg.
SQL QUERY: select avg(payloadmass__kg) from SPACEXTBL where booster_version like 'F9 v1.1%';
- The dates of the first successful landing outcome on ground pad was 2015-12-22.
SQL QUERY: select min(DATE) from SPACEXTBL where landing__outcome = 'Success (ground pad)';
- List the names of boosters which have successfully landed on drone ship and had payload mass greater than 4000 but less than 6000:
- F9 FT B1032.1
- F9 B4 B1040.1 vF9 B4 B1043.1
SQL QUERY: select distinct(booster_version) from SPACEXTBL where landingoutcome = 'Success (drone ship)' AND payload_masskg_ > 4000 AND payloadmass__kg < 6000;
- Rank the count of landing outcomes (such as Failure (drone ship) or Success (ground pad)) between the date 2010-06-04 and 2017-03-20, in descending order
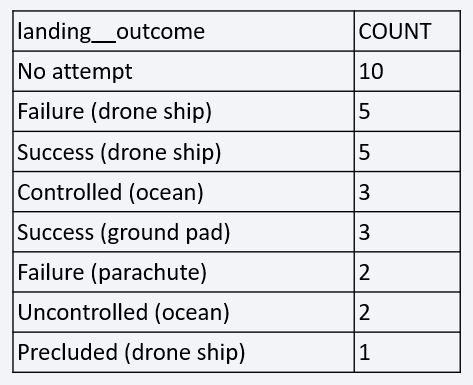
SQL QUERY: select landingoutcome,count(landingoutcome) as count from SPACEXTBL where DATE BETWEEN '2010-06-04' and '2017-03-20' GROUP BY landingoutcome ORDER BY count(landingoutcome) DESC;
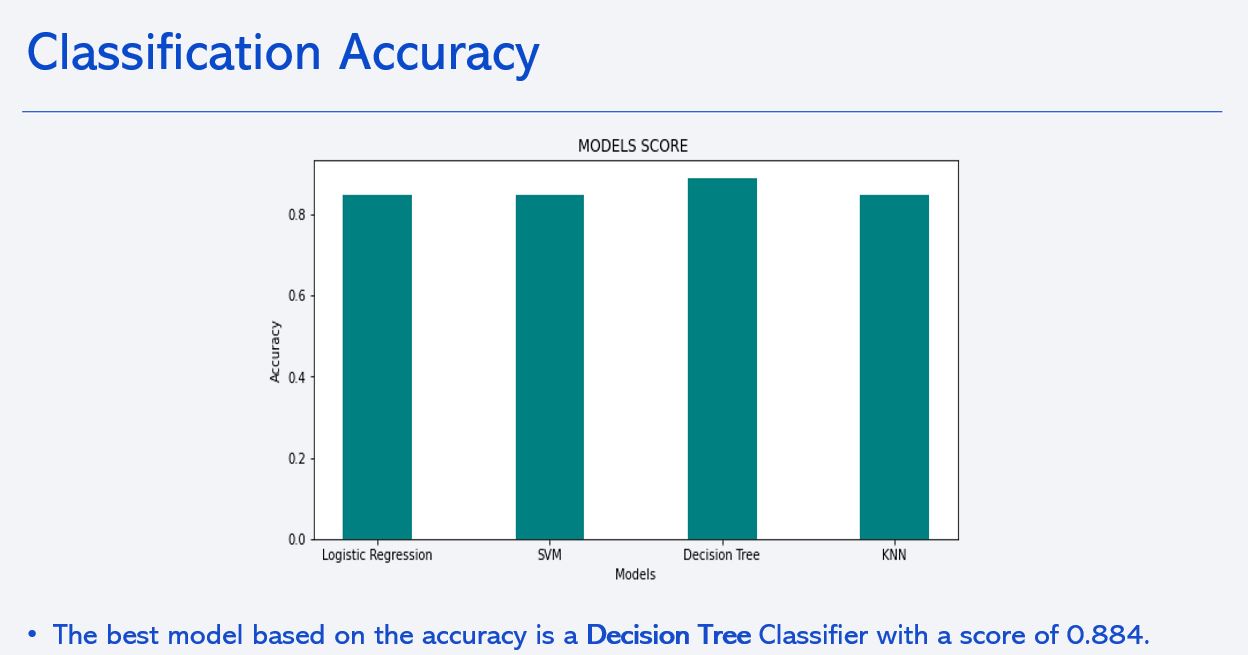
Classification Accuracy
The best model based on the accuracy is a Decision Tree Classifier with a score of 0.884.

The Confusion Matrix of the Decision Tree Classifier
- True Positive : 12
- False Negative : 0
- True Negative : 3
- False Positive : 3
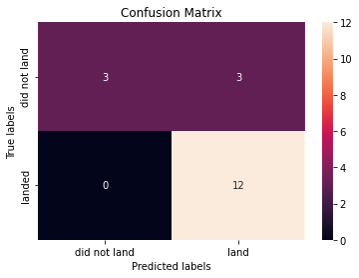
The model is quite interesting as it predicts a lot of times the good labels, however 3 times it predicted the success of the mission and the mission failed. Reducing the amount of False Positive would be a good idea to avoid spending Millions and years of work. It could be done using Boosting or maybe look at a model with a lower accuracy but a better precision.