Project
- Lock-Down’s Impact on India’s Air Quality
- Client: Govt of India
- Project date: 30 Augest, 2021
- Project URL:
- Investigation of the impact of lockdown on NO2 concentrations before and during different phases of lockdown.
- Used Sentinel-5P NRTI NO2: Near Real-Time NO2 dataset for analysis, imported from GEE Image-Collection.
- GeeMap, a Python package for interactive mapping with Google Earth Engine API, is used for the analysis.

Introduction:
Air pollution has become a severe problem in Indian cities due to rapid urbanization and industrialization, causing numerous
Results:
(a)
(b)
In 2020, the lockdown was imposed for a shorter period, but it contributed to a significant reduction in NO2 concentration throughout the year compared to the previous year

(March 25 to May 31) for 2019 and 2020. A huge reduction in tropospheric NO2 level is observed during the lockdown period in 2020 compared to 2019.
Lockdown Impact on tropospheric NO2:
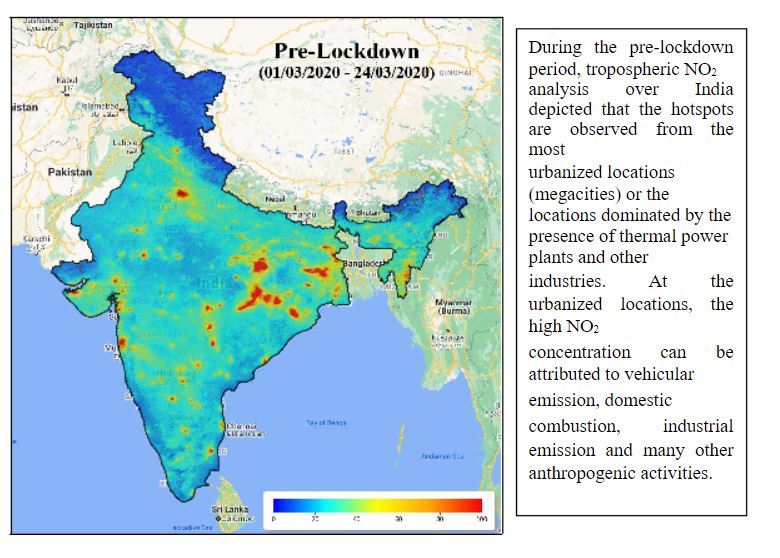
During the
analysis over India depicted that the hotspots are observed from the most
urbanized locations
(megacities) or the locations dominated by the presence of thermal power plants and other
industries. At the urbanized locations, the high NO2
concentration can be attributed to vehicular
emission, domestic
combustion, industrial emission and many other anthropogenic activities.

During the first phase of
lockdown, most of the urbanized locations (cities) shows a huge reduction in NO2 level that may be associated with a strict restriction in
transportation activities. Another major reason is the closure of industrial activities around the major cities, which is also a major source of air pollution, particularly NO2. However, some locations still show higher NO2 level. That were identifiesd as thermal power plant emissions in Jharkhand, Chhattisgarh, West- Bengal, Orisa and
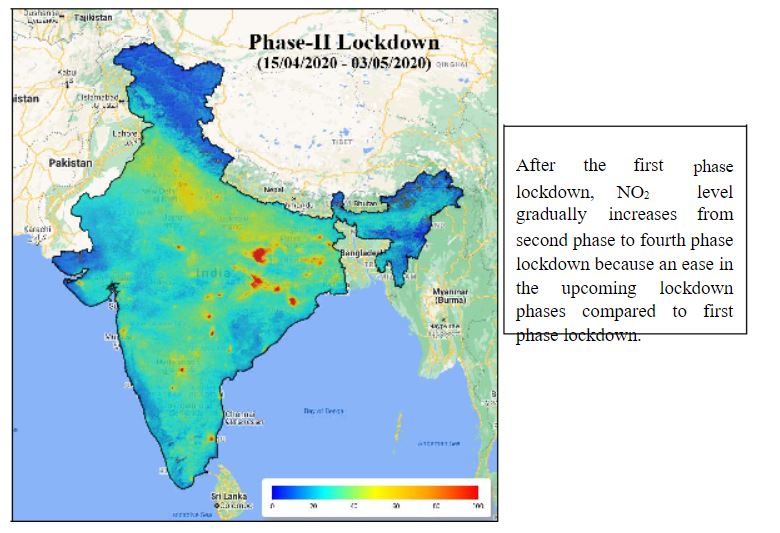
After |
the |
first |
phase |
lockdown, |
NO2 |
level |
|
gradually |
increases |
from |
|
second phase to fourth phase lockdown because an ease in the upcoming lockdown phases compared to first phase lockdown.

In the third and fourth phase of lockdown,
higher NO2 level is
observed over the Western UP, Punjab and Haryana states. These higher NO2 levels culd be attributed to the crop
residueburning
activities in the respected states.

NO2 analysis over the megacities Delhi and Bangalore:
Delhi
Bangalore
(01/03/2020 – 24/03/2020)
(25/03/2020 – 14/04/2020)
(15/04/2020 – 03/05/2020)

(04/05/2020 – 17/05/2020)
(18/05/2020 – 31/05/2020)
From the above spatial plots, It is observed that both the cities have the same trend in NO2 level during the study period. Both Delhi and Bangalore show the highest NO2 in the

Delhi
For the time series analysis, Satellite NO2 values have been extracted at the Lodhi Road IMD (CPCB station;[ 28.70, 77.10]) location for the lockdown duration (March 1 – May 31) for the years 2019 and 2020. Kaggle Air Quality Index(AQI) data has also been analyzed with the NO2 level at the respective locations and durations. It has been observed that the NO2 level remains much lower in 2020 compared to 2019. Throughout the lockdown duration, 2020 shows significantly improved Air Quality compared to 2019.
**breaks in plots are due to the missing data
Bangalore
A similar analysis has been performed for Bangalore, India. At BTM Layout,